This web-based project is all about teaching you implementing data binding option and its features on a javascript file through...
Advertisement:
Read Later
This web-based project is all about teaching you implementing data binding option and its features on a javascript file through...
Related Links :
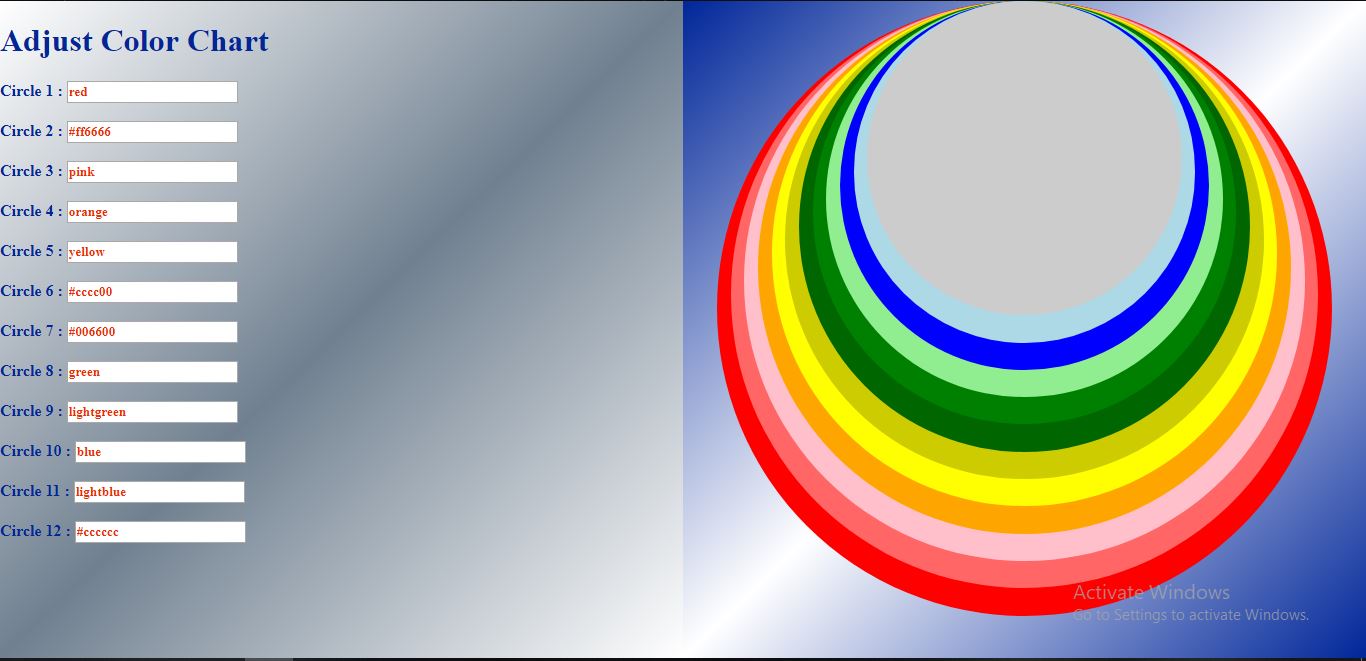
AngularJSThis web-based project is all about teaching you implementing data binding option and its features on a javascript file through ajax.googleapis.com. After taking this tutorial, you will be acquainted with the app, module, controller and last but not least directive feature in AngularJS. Furthermore, ng-model features and the data binding process with input elements are well-explained throughout the source code. To inspect the project itself, you can click the preview button down below; to download project tools, you can use download as zip folder option by subscribing.
For more information about the code files, please visit Source Code section below.
First of all, you have to start AngularJS apps and controllers above the script at which they are executed , using ng-app and ng-controller.
In this case, the app and controller are named as Chart and Color, you have to initial them with these names.
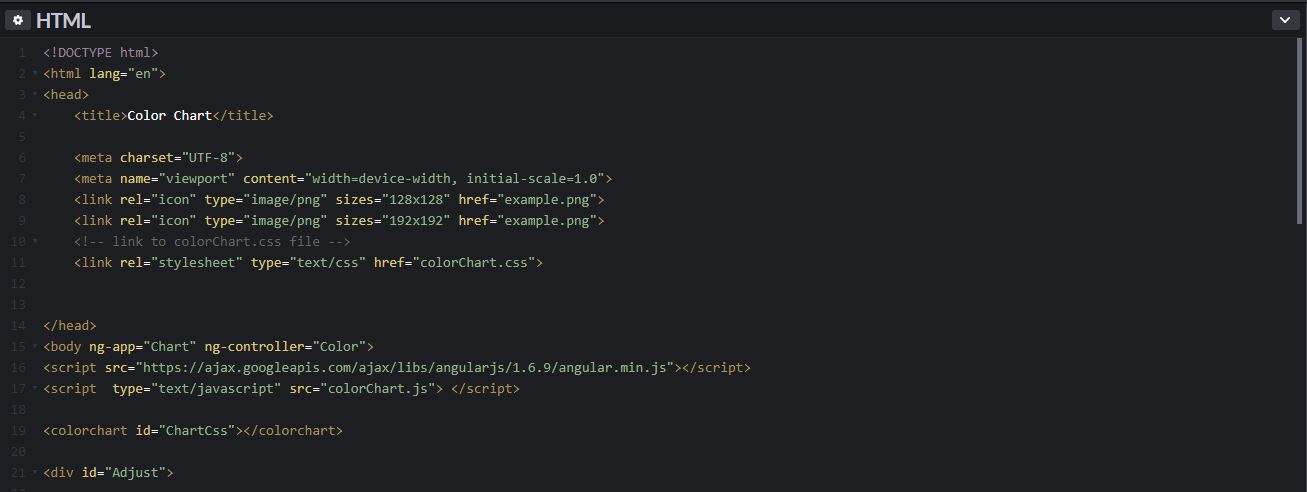
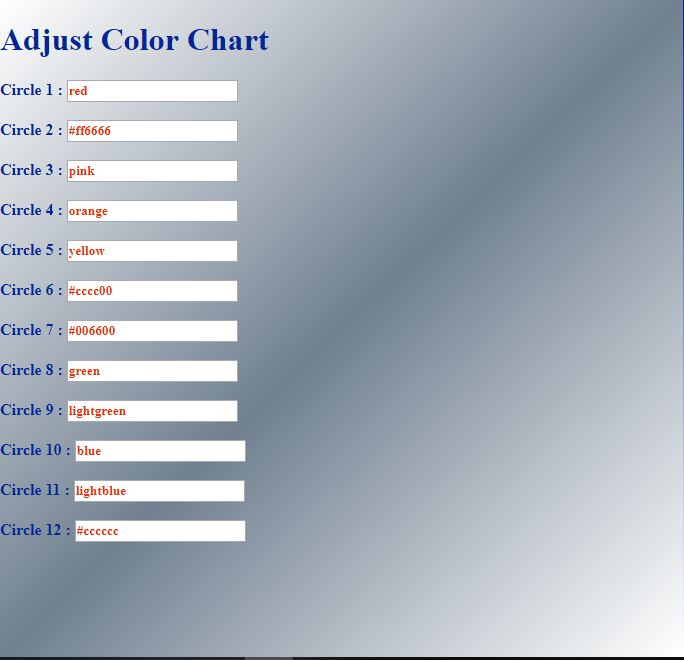
After implementing AngularJS as script tag format, it is ready to add input elements on body.
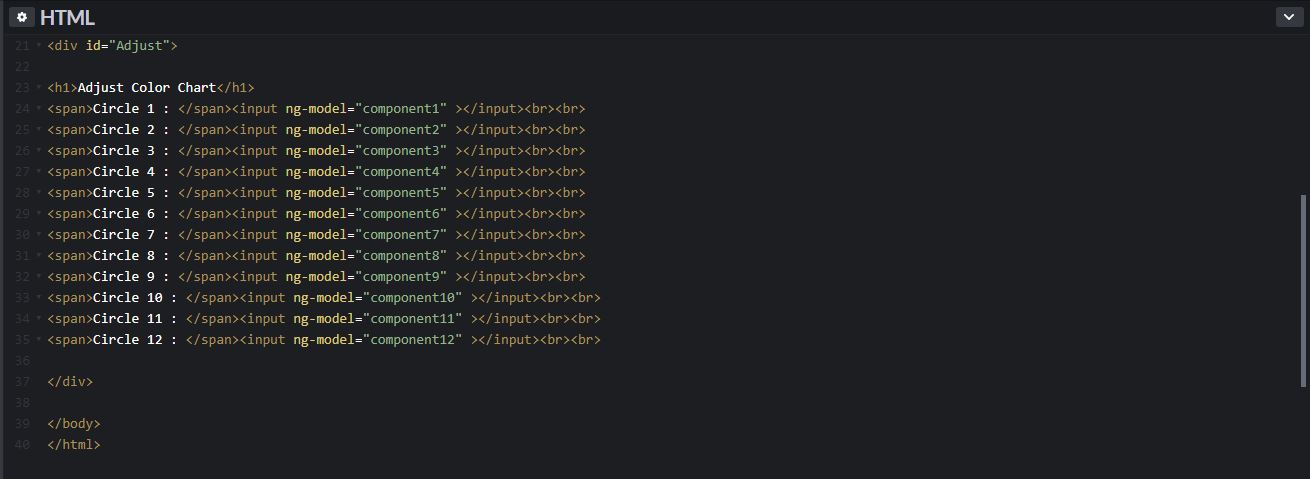
Now, you can bind data defined at colorChart.js as $scope variables to input elements by using ng-model like ng-model="component1".
In this method, you can either use pre-defined $scope variables or re-defined $scope variables in functions.
After creating module and controller variables to start Chart app and Color controller, you have to define $scope variables for data binding primarily.
app.controller('Color', function($scope) {
$scope.component1 = "red";
$scope.component2 = "#ff6666";
});
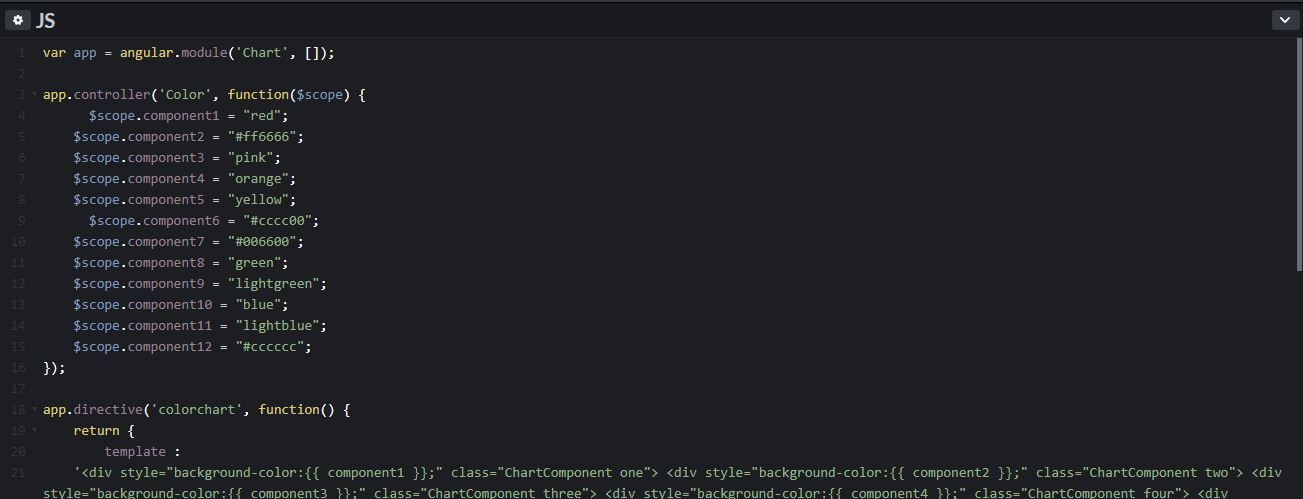
Now, it is ready to create a directive, in this case, named as colorchart. Do not forget that directives can be used as elements with id and class name as well as an html element with tags.
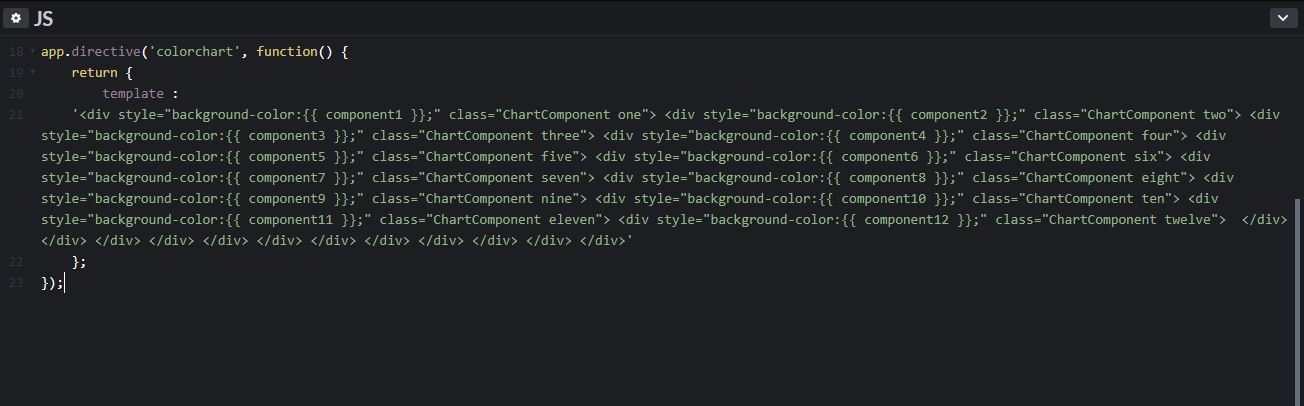
By using template, you can execute other elements and functions in directives without rows of html code.
After that, bind $scope variables to colorchart in which circle divs placed, using other binding method known as two brackets method - {{ component1 }} .
<div style="background-color:{{ component1 }};" class="ChartComponent one"> ...
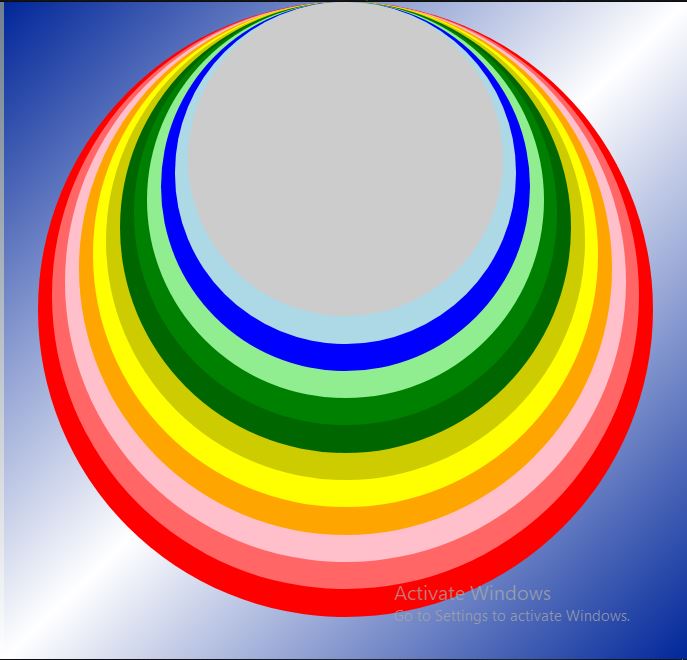
For making circle divs look like a color chart, use a combination of border, margin and arithmetically reduced width values for each circle div.
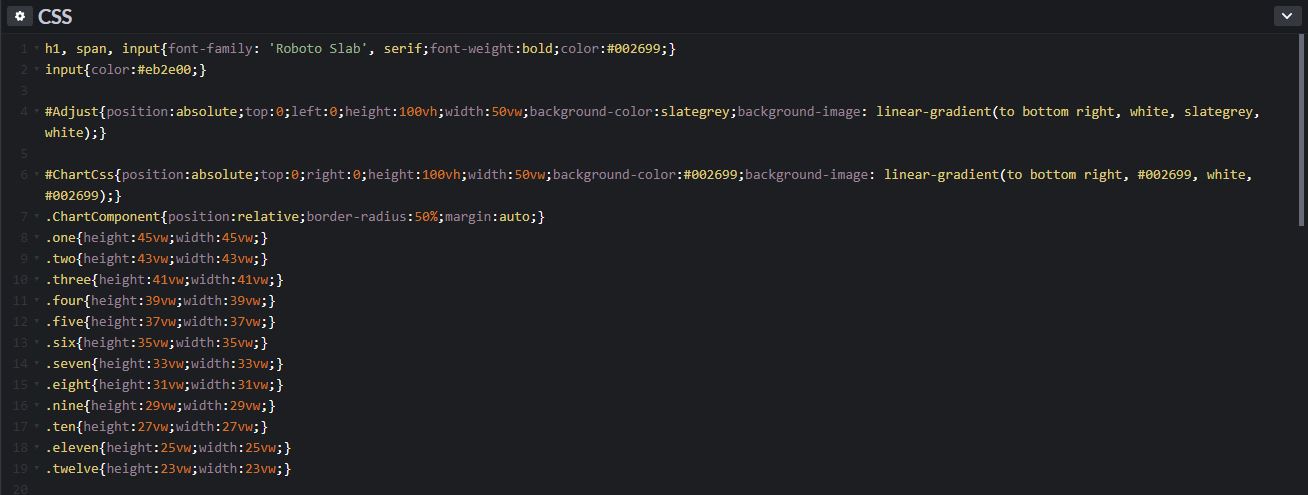
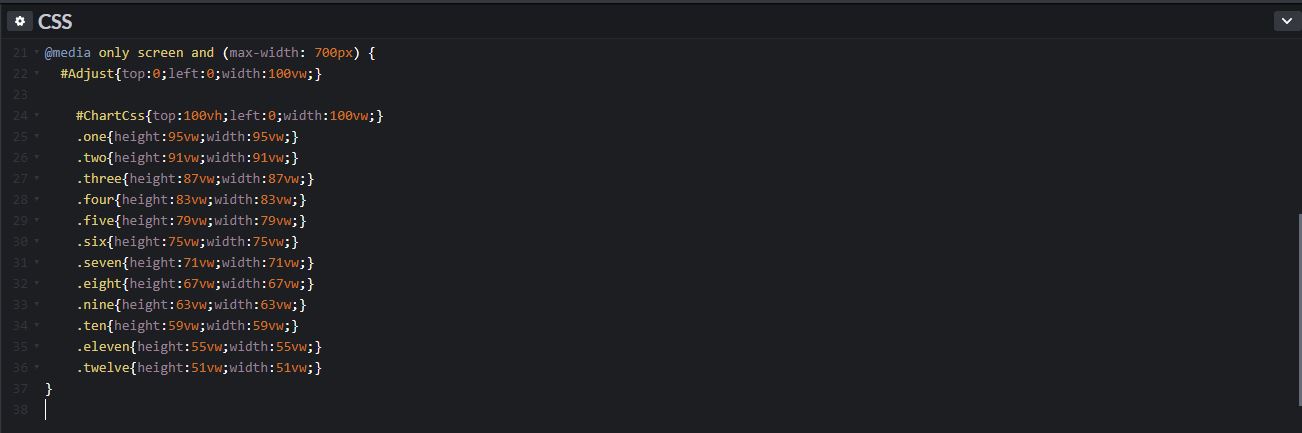
Do not forget to add @media rules for its mobile version and compatibility to other devices.
Also, as an alternative, you can execute the source code with Selenium in Protractor Framework by clicking the following link below.
https://www.guru99.com/protractor-testing.html
Please sign in to download source code files below as zip folder, including index.html.
Zip Folder
Download
colorChart.js
Download
var app = angular.module('Chart', []);

app.controller('Color', function($scope) {
      $scope.component1 = "red";
	  $scope.component2 = "#ff6666";
	  $scope.component3 = "pink";
	  $scope.component4 = "orange";
	  $scope.component5 = "yellow";
      $scope.component6 = "#cccc00";
	  $scope.component7 = "#006600";
	  $scope.component8 = "green";
	  $scope.component9 = "lightgreen";
	  $scope.component10 = "blue";
	  $scope.component11 = "lightblue";
	  $scope.component12 = "#cccccc";
});

app.directive('colorchart', function() {
    return {
        template :
		'<div style="background-color:{{ component1 }};" class="ChartComponent one"> <div style="background-color:{{ component2 }};" class="ChartComponent two"> <div style="background-color:{{ component3 }};" class="ChartComponent three"> <div style="background-color:{{ component4 }};" class="ChartComponent four"> <div style="background-color:{{ component5 }};" class="ChartComponent five"> <div style="background-color:{{ component6 }};" class="ChartComponent six"> <div style="background-color:{{ component7 }};" class="ChartComponent seven"> <div style="background-color:{{ component8 }};" class="ChartComponent eight"> <div style="background-color:{{ component9 }};" class="ChartComponent nine"> <div style="background-color:{{ component10 }};" class="ChartComponent ten"> <div style="background-color:{{ component11 }};" class="ChartComponent eleven"> <div style="background-color:{{ component12 }};" class="ChartComponent twelve">  </div> </div> </div> </div> </div> </div> </div> </div> </div> </div> </div> </div>'

   };
});
colorChart.css
Download
h1, span, input{font-family: 'Roboto Slab', serif;font-weight:bold;color:#002699;}
input{color:#eb2e00;}

#Adjust{position:absolute;top:0;left:0;height:100vh;width:50vw;background-color:slategrey;background-image: linear-gradient(to bottom right, white, slategrey, white);}

#ChartCss{position:absolute;top:0;right:0;height:100vh;width:50vw;background-color:#002699;background-image: linear-gradient(to bottom right, #002699, white, #002699);}
.ChartComponent{position:relative;border-radius:50%;margin:auto;}
.one{height:45vw;width:45vw;}
.two{height:43vw;width:43vw;}
.three{height:41vw;width:41vw;}
.four{height:39vw;width:39vw;}
.five{height:37vw;width:37vw;}
.six{height:35vw;width:35vw;}
.seven{height:33vw;width:33vw;}
.eight{height:31vw;width:31vw;}
.nine{height:29vw;width:29vw;}
.ten{height:27vw;width:27vw;}
.eleven{height:25vw;width:25vw;}
.twelve{height:23vw;width:23vw;}

@media only screen and (max-width: 700px) {
	#Adjust{top:0;left:0;width:100vw;}

    #ChartCss{top:100vh;left:0;width:100vw;}
    .one{height:95vw;width:95vw;}
    .two{height:91vw;width:91vw;}
    .three{height:87vw;width:87vw;}
    .four{height:83vw;width:83vw;}
    .five{height:79vw;width:79vw;}
    .six{height:75vw;width:75vw;}
    .seven{height:71vw;width:71vw;}
    .eight{height:67vw;width:67vw;}
    .nine{height:63vw;width:63vw;}
    .ten{height:59vw;width:59vw;}
    .eleven{height:55vw;width:55vw;}
    .twelve{height:51vw;width:51vw;}
}