[1]DFRobot Weather Station Kit with Anemometer / Wind Vane / Rain Bucket
[1]NodeMCU ESP-12E (ESP8266)
[1]DFRobot SIM808 GPS/GPRS/GSM Shield
[1]Arduino Uno
[1]Raspberry Pi 3B+ or 4
Description
Especially in 2020, instant heavy and violent rainfalls have caused detrimental effects on greenhouses and crop yields in my country. Unfortunately, these days unexpected and excessive rainfalls occur more frequently and became relatively common due to climate change in some areas. Meanwhile, other regions suffer from drought. As 2020 passes, more than thirty-five incidents that caused the loss of crops and livestock due to heavy and violent rainfalls are recorded in my region. To contribute to the solution to forfend and avert excessive rainfall instigated problems like agricultural productivity loss, I contemplated this project as a starting point.
Primarily, I focused on excessive rainfall effects on agriculture in this project. However, excessive rainfalls can lead to numerous hazards, for example [1]:
flooding, including risk to human life,
damage to buildings and infrastructure,
loss of crops and livestock,
landslides, which can threaten human life, disrupt transport and communications.
As shown in the latest studies, excessive rainfall can affect crop productivity in various ways, including direct physical damage, delayed planting and harvesting, restricted root growth, oxygen deficiency, and nutrient loss. Thus, too much rain can be as dangerous as drought for agriculture: "Data from the past three decades suggest that excessive rainfall can affect crop yield as much as excessive heat and drought. In a new study, an interdisciplinary team from the University of Illinois linked crop insurance, climate, soil, and corn yield data from 1981 through 2016. The study found that, during some years, excessive rainfall reduced U.S. corn yield by as much as 34% relative to the expected yield. Data suggest that drought and excessive heat caused a yield loss of up to 37% during some years [2]".
Unfortunately, early warning systems are not enough to entirely prevent exacerbating effects of excessive rainfall on agricultural products and processes without adequate and preliminary local weather data for each greenhouse or farm. Therefore, in the hope of averting the detrimental effects of excessive rainfall on agriculture, I decided to create this project as a budget-friendly remote weather station to collect and interpret local weather information to make more accurate predictions on the rainfall intensity.
After doing some research about deep learning and neural networks, I decided to build an artificial neural network (ANN) based on the classification model to interpret the accumulated local weather data to predict the rainfall intensity according to the given classes. As the following study indicates, researchers have applied different neural network models and types to forecast not only rainfalls but also weather phenomena: "Many experiments have used neural networks to predict quantitative rainfall amounts at various locations and look-ahead ranges. For instance, researchers in Thailand were able to obtain highly accurate forecasts using feed-forward neural networks to predict quantitative rainfall amounts in the one to three-hour look-ahead range in order to predict possible flooding dangers. Neural networks have also been used to predict weather phenomena besides the traditional forecast values, such as probability/amount of rainfall, wind speed, barometric pressure, etc. They have been used very successfully to predict tornadoes. Additionally, researchers in Australia successfully used a neural network to identify fog at various forecast ranges ranging from 3 hours to 18 hours around Canberra International Airport [3]."
Before building and testing my neural network model, I had collected weather data at my balcony and backyard in three kilometers radius for more than three months to create a local weather data set showing weather information in my neighborhood. To be able to elicit weather information even in extreme weather conditions, I used a Weather Station Kit with Anemometer, Wind Vane, and Rain Bucket by DFRobot with two different development boards:
NodeMCU ESP-12E (WiFi-Enabled)
Arduino Uno + DFRobot SIM808 GPS/GPRS/GSM Shield (GPRS-Enabled)
Thus, I could transfer weather data via WiFi at my balcony or GPRS if the distance between my router and the weather station is too far away.
I decided to use Google Sheets, a cloud-based spreadsheet program, to collate weather data generated by the weather station because creating big data sets and appending new information are simple with the Google Sheets API. Hence, I developed a web application in PHP to obtain weather data transferred by the development boards and append it to a spreadsheet on Google Sheets.
After completing collecting weather data for more than three months every five minutes, I built an artificial neural network (ANN) model with TensorFlow to make predictions on the rainfall intensity. Theoretically, I assigned a rainfall intensity class for each reading after scaling and normalizing the data set. Then, I trained the neural network model to classify these classes:
No Rainfall
Light Rainfall
Moderate Rainfall
Heavy Rainfall
Violent Rainfall
So, this is my project in a nutshell 😃
In the following steps, you can find more detailed information on coding, local weather data collection, and building an artificial neural network (ANN) model with TensorFlow.
Huge thanks to DFRobot for sponsoring this project.
Sponsored products by DFRobot:
⭐ Weather Station Kit with Anemometer/Wind Vane/Rain Bucket | Inspect
⭐ SIM808 GPS/GPRS/GSM Shield For Arduino | Inspect
Figure - 58.1
Figure - 58.2
Figure - 58.3
Step 1: Assembling the weather station kit with an anemometer, wind vane, and rain bucket
This weather station kit includes an anemometer, wind vine, rain bucket, and a sensor board to send weather data via the serial communication protocol. Thus, it is easy-to-use with development boards to collect local weather data.
It outputs 37 bytes per second, including the end CR/LF.
c000s000g000t086r000p000h53b10020
Data Parser:
c000 : air direction, degree
s000 : air speed (average), 0.1 miles per hour
g000 : air speed (max), 0.1 miles per hour
t086 : temperature, Fahrenheit
r000 : rainfall (1 hour), 0.01 inches
p000 : rainfall (24 hours), 0.01 inches
h53 : humidity, % (00%= 100)
b10020 : atmosphere, 0.1 hPa
⭐ First of all, attach the anemometer and the wind vane to the bridge by using screws and nuts.
⭐ Connect the wind vane to the anemometer by using the RJ11 phone cord and tighten it under the bridge.
Figure - 58.4
Figure - 58.5
⭐ Then, mount the stainless steel stick to the bridge with screws.
Figure - 58.6
⭐ Install the rain bucket joint under the rain bucket with screws.
Figure - 58.7
⭐ Lastly, place the rain bucket on the stainless steel stick by using screws and nuts.
Figure - 58.8
⭐ Now, it is ready to collect weather data even in extreme weather conditions. However, the sensor (converter) board is not weather-proof, so I added a plastic box to the weather station to protect the sensor board and the SIM808 shield outdoors.
Step 2: Collecting weather data on Google Sheets
To be able to send information to a spreadsheet on Google Sheets, you need to create a new application in the Google Developer Console and get verification credentials to utilize the Google Sheets API. If you are a novice in creating applications with the Google Developer Console, follow the instructions below.
⭐ Go to Google Developer Console and click the 'NEW PROJECT' button. Enter the project name as Remote Weather Station.
Figure - 58.9
⭐ Go to the APIs & Services and click to the API library to enable the Google Sheets API.
Figure - 58.10
Figure - 58.11
Step 2.1: Getting credentials to use the Google Sheets API
⭐ Open the project dashboard and click the Credentials button. Then, fill the form as depicted below to create the service account and key.
Figure - 58.12
Figure - 58.13
Figure - 58.14
⭐ Click the CREATE CREDENTIALS button and configure the consent screen to be able to create an OAuth client ID.
Figure - 58.15
Figure - 58.16
⭐ Then, create a new OAuth client ID named Client under Desktop app (application type).
Figure - 58.17
⭐ After creating the OAuth client ID (Client), download the credentials (ID and Secret) and name the file as credentials.json.
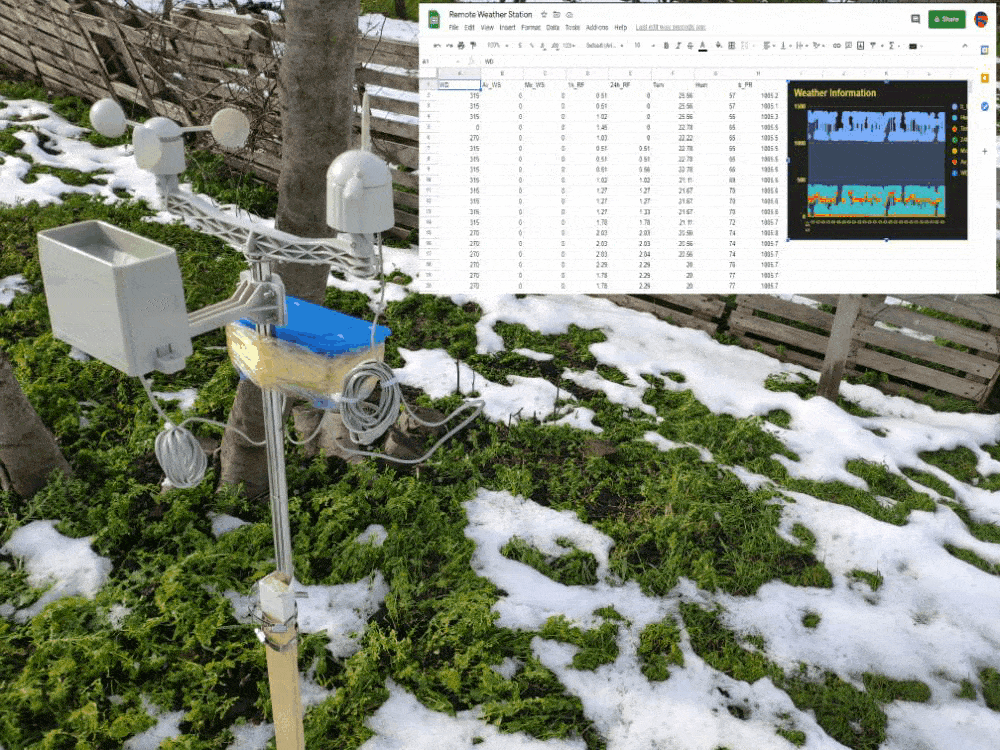
⭐ Create a Blank spreadsheet and name it Remote Weather Station.
⭐ Then, define the column names as the first row:
WD
Av_WS
Mx_WS
1h_RF
24h_RF
Tem
Hum
b_PR
⭐ If needed, modify a chart to inspect the collected data, as did I.
Figure - 58.21
Step 3: Developing a web application in PHP to append weather data to the spreadsheet
This PHP web application is for getting weather data transferred by the development boards (ESP8266 and SIM808) via an HTTP Get request and appending that data to a given spreadsheet (by ID) on Google Sheets with verified credentials and token.
The web application requires the Google Client Library for PHP to append weather data to a given spreadsheet on Google Sheets.
⭐ So, first of all, create a folder named remote_weather_station in your server and install the Google Client Library for PHP in it.
The remote_weather_station folder should include these four files in addition to the Google Client Library to work:
index.php
account_verification_token.php
credentials.json (Step 2.1)
token.json (Step 3.1)
In this step, I will discuss the first two files - index.php and account_verification_token.php:
💻 index.php
⭐ Get local weather data from the weather station via a Get request:
⭐ If there is no previous token or expired, request authorization from the user and set the verification code to create the token.json file with the file_put_contents() function.
if ($client->isAccessTokenExpired()) {
// Refresh the token if possible, else fetch a new one.
if ($client->getRefreshToken()) {
$client->fetchAccessTokenWithRefreshToken($client->getRefreshToken());
} else {
// Request authorization from the user.
$authUrl = $client->createAuthUrl();
...
// Set the verification code to create the token.json.
$authCode = trim($GLOBALS['account_verification_token']);
...
// Check to see if there was an error and the account_verification_token is entered.
if (array_key_exists('error', $accessToken)) {
throw new Exception(join(', ', $accessToken));
}else{
print("Successful! Refresh the page.");
}
}
// Save the token to a file.
if (!file_exists(dirname($tokenPath))) {
mkdir(dirname($tokenPath), 0700, true);
}
file_put_contents($tokenPath, json_encode($client->getAccessToken()));
}
⭐ Enter the spreadsheet ID and range to append recent findings from the weather station to the spreadsheet.
// Enter your spreadsheetId:
$spreadsheetId = '<spreadsheet_ID>';
// Enter the range (the first row) under which new values will be appended (8 rows):
$range = 'A1:H1';
// Append recent findings from the weather station to the spreadsheet.
$values = [
[$variables_from_module["wd"], $variables_from_module["a_ws"], $variables_from_module["m_ws"], $variables_from_module["1_rf"], $variables_from_module["24_rf"], $variables_from_module["tem"], $variables_from_module["hum"], $variables_from_module["b_pr"]]
];
$body = new Google_Service_Sheets_ValueRange([
'values' => $values
]);
$params = [
'valueInputOption' => "RAW"
];
...
$result = $service->spreadsheets_values->append($spreadsheetId, $range, $body, $params);
printf("<br><br>%d cells appended.", $result->getUpdates()->getUpdatedCells());
💻 account_verification_token.php
⭐ After authorizing the web application by the created AuthUrl, enter the given verification code to set an access token.
$account_verification_token = "<Enter Token>"; // Enter the verification code after authorization.
Figure - 58.22
Figure - 58.23
Step 3.1: Setting up the web application on Raspberry Pi (or any server)
After creating the PHP web application, I decided to run it on my Raspberry Pi, but you can run the application on any server as long as it is a PHP server.
If you want to use Raspberry Pi but do not know how to set up a LAMP web server on Raspberry Pi, you can inspect this tutorial.
⭐ First of all, move the application folder (remote_weather_station) to the apache server (/var/www/html) by using the terminal since the apache server is a protected location.
⭐ The web application throws an error when opened for the first time due to the missing verification code. To obtain the verification code, go to the generated authorization link by the application.
Figure - 58.25
⭐ Then, click to Go to Remote Weather Station (unsafe).
Figure - 58.26
⭐ Grant the application with the required permissions.
Figure - 58.27
⭐ Now, copy the verification code and paste it into account_verification_token.php.
Figure - 58.28
⭐ Return to the web application. It should display the confirmation message: Successful! Refresh the page.
Figure - 58.29
⭐ After refreshing the page, the web application uses the verification code to get an access token and saves the access token in a file named token.json. Thus, it does not throw an error again.
Figure - 58.30
⭐ To test whether the PHP web application is appending new data to the given spreadsheet accurately:
⭐ Send data packets every 5 minutes to Raspberry Pi (or any server).
transferring++; Serial.println("Time => " + String(transferring) + "s / " + String(int(5*60)) + "s\n\n");
if(transferring == 5*60){
// Create the HTTP object to make a request to the server.
HTTPClient http;
http.begin(server + weather_data);
int httpCode = http.GET();
String payload = http.getString();
Serial.println("Data Send...\nHTTP Code => " + String(httpCode) + "\nServer Response => " + payload + "\n\n");
http.end();
transferring = 0;
}
// Wait 1 second...
delay(1000);
Figure - 58.34
⭐ After uploading the code to the NodeMCU ESP-12E (ESP8266) development board, it displays weather data every second on the serial monitor and sends data packets every five minutes (300 seconds) to the PHP web application.
Connection is successful!
...
Weather Data => wd=0&a_ws=0.00&m_ws=0.00&1_rf=0.00&24_rf=0.00&tem=21.67&hum=29&b_pr=1016.70
Buffer => c000s000g000t071r000p000h29b10167*3
Time => 299s / 300s
Weather Data => wd=0&a_ws=0.00&m_ws=0.00&1_rf=0.00&24_rf=0.00&tem=21.67&hum=29&b_pr=1016.70
Buffer => c000s000g000t071r000p000h29b10167*3
Time => 300s / 300s
...
⭐ Then, it shows the response from the server.
...
Data Send...
HTTP Code => 200
Server Response => Token Found!
8 cells appended.
...
Figure - 58.35
Figure - 58.36
Step 4.1: Reading and sending weather data with SIM808 (GPRS)
To collect weather data in my backyard, I used a SIM808 shield for Arduino Uno if the distance between the weather station and my router is too far away.
Most of the code is the same and covered in the previous step aside from the parts below.
Figure - 58.37
⭐ Include required libraries and define the sim808 object.
⭐ After creating the line string, convert it from string to char array to make an HTTP Get Request with the SIM808.
...
String line = "GET /remote_weather_station/?" + weather_data_1 + weather_data_2 + weather_data_3 + " HTTP/1.0\r\n\r\n";
Serial.println(line);
char buffer[512];
// Convert the line from string to char array to make an HTTP Get Request with the SIM808.
char web_hook[110];
String_to_Char(line, 110, web_hook);
sim808.send(web_hook, sizeof(web_hook)-1);
while (true) {
int ret = sim808.recv(buffer, sizeof(buffer)-1);
if (ret <= 0){
Serial.println("Fetch Over...");
break;
}
...
Figure - 58.38
⭐ After uploading the code to the SIM808 shield, it displays weather data every second on the serial monitor and sends data packets every five minutes (300 seconds) to the PHP web application.
Figure - 58.39
Figure - 58.40
Step 4.2: Creating the weather data set for more than three months
After finishing coding, I started to collate weather data on Google Sheets every five minutes for more than three months to build a neural network model and make predictions on the rainfall intensity.
Collected Weather Data:
Wind Direction (deg)
Average Wind Speed (m/s)
Max Wind Speed (m/s)
One-Hour Rainfall (mm)
24-Hours Rainfall (mm)
Temperature (°C)
Humidity (%)
Barometric Pressure (hPa)
Then, I downloaded the spreadsheet as Remote Weather Station.csv, consisting of 32219 rows as my preliminary local weather data set. I am still collating weather data to improve my data set and model :)
Figure - 58.41
Figure - 58.42
Step 5: Building an Artificial Neural Network (ANN) with TensorFlow
When I completed collating my preliminary local weather data set, I started to work on my artificial neural network (ANN) model to make predictions on the rainfall intensity.
I decided to create my neural network model with TensorFlow in Python. So, first of all, I followed the steps below to grasp a better understanding of the weather data:
Data Visualization
Data Scaling (Normalizing)
Data Preprocessing
Data Splitting
After applying these steps, I decided to use my neural network model to classify different rainfall intensity classes theoretically assigned as labels (outputs) for each input (row). I created my classes according to the rate of precipitation, which depends on the considered time.
The following categories are used to classify rainfall intensity by the rate of precipitation (rainfall):
Light rain — when the precipitation rate is < 2.5 mm per hour
Moderate rain — when the precipitation rate is between 2.5 mm and 7.6 mm per hour
Heavy rain — when the precipitation rate is between 7.6 mm and 50 mm per hour
Violent rain — when the precipitation rate is > 50 mm per hour
According to the precipitation (rainfall) rates, I preprocessed the weather data to assign one of these five classes for each input as its label:
0 (None)
1 (Light Rain)
2 (Moderate Rain)
3 (Heavy Rain)
4 (Violent Rain)
After scaling (normalizing) and preprocessing the weather data, I elicited seven input variables and one label for each reading, classified with the five mentioned classes. Then, I built an artificial neural network model with TensorFlow to obtain the best possible results and predictions with my preliminary data set.
Layers:
7 [Input]
16 [Hidden]
32 [Hidden]
64 [Hidden]
128 [Hidden]
5 [Output]
Figure - 58.43
Figure - 58.44
To execute all steps above, I created a class named Weather_Station in Python after including the required libraries:
import tensorflow as tf
from tensorflow import keras
import matplotlib.pyplot as plt
import numpy as np
import pandas as pd
Subsequently, I will discuss coding in Python for each step I mentioned above.
Also, you can download IoT_weather_station_neural_network.py to inspect coding.
Figure - 58.45
Figure - 58.46
Step 5.1: Visualizing and scaling (normalizing) the weather data
Before diving in to build a model, it is important to understand the weather data to pass the model appropriately formatted data.
So, in this step, I will show you how to visualize weather data and scale (normalize) in Python.
⭐ First of all, read the weather data from Remote Weather Station.csv.
After visualizing weather data, I scaled (normalized) each column to format it properly.
Normally, each row (reading) looked like this before scaling:
315, 0.45, 0, 0.51, 0.51, 22.78, 65, 1005.5
⭐ In the scale_data() function:
⭐ The wind direction in units of degrees and angles do not make good model inputs. 360° and 0° should be close to each other and wrap around smoothly. The direction should not matter if the wind is not blowing. Thus, convert the wind direction and velocity columns to a wind vector to interpret them easily with a neural network model.
def scale_data(self):
# Wind Direction and Speed:
wv = self.df.pop('Av_WS')
max_wv = self.df.pop('Mx_WS')
# Convert to radians.
wd_rad = self.df.pop('WD')*np.pi / 180
# Calculate the wind x and y components.
self.df['scaled_WX'] = wv*np.cos(wd_rad)
self.df['scaled_WY'] = wv*np.sin(wd_rad)
# Calculate the max wind x and y components.
self.df['scaled_max_WX'] = max_wv*np.cos(wd_rad)
self.df['scaled_max_WY'] = max_wv*np.sin(wd_rad)
...
⭐ For the remaining columns except for 1h_RF, divide them into average reading values to scale (normalize) and format.
After completing scaling (normalizing), I extracted these new columns from the weather data set:
scaled_WX
scaled_WY
scaled_max_WX
scaled_max_WY
scaled_Tem
scaled_Hum
scaled_bPR
scaled_24h_RF
Step 5.2: Training the model (ANN) on the rainfall intensity classes
Before building and training a neural network model in TensorFlow, I needed to create the input array and the label array by preprocessing the scaled and normalized weather data set.
⭐ In the create_input_and_label() function:
⭐ Firstly, append each input element as a NumPy array to the input array and convert it to a NumPy array by using the asarray() function.
⭐ Each input element includes seven variables [shape=(7,)]:
def create_input_and_label(self):
n = len(self.df)
# Create the input array using the scaled variables:
for i in range(n):
self.input.append(np.array([self.df['scaled_WX'][i], self.df['scaled_WY'][i], self.df['scaled_max_WX'][i], self.df['scaled_max_WY'][i], self.df['scaled_Tem'][i], self.df['scaled_Hum'][i], self.df['scaled_bPR'][i]]))
self.input = np.asarray(self.input)
...
⭐ Then, evaluate the approximate rainfall (precipitation) rate for each reading (row).
approx_RF_rate = (1h_RF + scaled_24h_RF) * 100
⭐ According to the rainfall rate, assign a class [0 - 4] for each input element and append them to the label array.
...
for i in range(n):
_class = 0
# Evaluate the approximate rainfall rate:
approx_RF_rate = (self.df['1h_RF'][i] + self.df['scaled_24h_RF'][i]) * 100
# As labels, assign classes of rainfall intensity according to the approximate rainfall rate (mm):
if approx_RF_rate == 0:
_class = 0
elif approx_RF_rate < 2.5:
_class = 1
elif 2.5 < approx_RF_rate and approx_RF_rate < 7.6:
_class = 2
elif 7.6 < approx_RF_rate and approx_RF_rate < 50:
_class = 3
else:
_class = 4
self.label.append(_class)
self.label = np.asarray(self.label)
After preprocessing the scaled weather data to create input and label arrays, I split them as training (60%) and test (40%) data sets:
After training with the preliminary training data set, the accuracy of the model is between 0.83 and 0.85.
Figure - 58.51
Step 5.3: Evaluating the model and making predictions on the rainfall intensity
After building and training my artificial neural network model, I tested its accuracy by using the preliminary testing data set.
For now, the evaluated accuracy of the model is between 0.72 and 0.73 due to inadequate testing data set overfitting the model. However, I am still collecting weather data to improve the model accuracy.
...
# Test the accuracy:
print("\n\nModel Evaluation:")
test_loss, test_acc = self.model.evaluate(self.test_input, self.test_label)
print("Evaluated Accuracy: ", test_acc)
Then, I used my neural network model to make predictions on the rainfall intensity with a given prediction array consisting of readings from the weather station after the training of the model. As a starting point, the model works fine :)
The model predicts possibilities of labels for each input element as an array of 5 numbers. They represent the model's "confidence" that the given input element corresponds to each of the five different classes of rainfall intensity [0 - 4].
⭐ In the make_prediction() function, make a prediction for each input element in a given array and get the most accurate label [0 - 4] by using the argmax() function to display its class name.
def make_prediction(self, pre_array):
print("\n\nModel Predictions:\n")
prediction = self.model.predict(pre_array)
for i in range(len(pre_array)):
print("Prediction => ", self.class_names[np.argmax(prediction[i])])
I connected the sensor (converter) board to the NodeMCU ESP-12E (ESP8266) development board and fastened them to a plastic box while collecting weather data at my balcony.
⭐ Note: D0, D1, D12 pins are occupied by the SIM808 GPS/GPRS/GSM Shield.
⭐ Connect an external battery (7-23V) for the SIM808 module to work properly.
⭐ Attach the GPS antenna and the GSM antenna to the SIM808 shield.
⭐ Insert a SIM card into the SIM slot on the SIM808 shield.
⭐ Before uploading the code, set the function switch on the shield to None (1).
⭐ Upload the code.
⭐ Then, set the function switch to Arduino (3).
⭐ Press the Boot button on the shield until seeing the Net indicator LED flashing every 1 second and wait for the SIM card to register the network - the Net indicator LED will slowly flash every 3 seconds.
⭐ Click here to get more information about the SIM808 GSM/GPS/GPRS Shield.
After setting up the SIM808 shield with Arduino Uno, I connected the sensor (converter) board to it.
Figure - 58.54
I placed all components into a plastic box to collect weather data outside, even in extreme weather conditions, since the sensor board is not weather-proof.
Figure - 58.55
Then, I fastened the plastic box to the weather station.
Figure - 58.56
Videos and Conclusion
After completing coding and assembling the weather station, I collated local weather data for more than three months every five minutes to build my neural network model successfully.
I am still collecting weather data at my balcony and backyard to improve my neural network model and its accuracy :)
Figure - 58.57
Figure - 58.58
Figure - 58.59
Further Discussions
☔ 💧 Since we need local weather data sets to get more accurate predictions on weather phenomena, budget-friendly NN-enabled weather stations like this can be placed on farms and greenhouses to avert the detrimental effects of excessive rainfall on agriculture.
☔ 💧 As early warning systems working with neural networks, we can use them simultaneously to create a swarm of weather stations communicating and feeding each other to forecast rainfall intensity precisely in local areas.
☔ 💧 Also, we can utilize that information for assessing:
vital water resources,
agriculture,
crop productivity,
ecosystems,
hydrology.
Figure - 58.60
Figure - 58.61
References
[1]Extreme weather - heavy rainfall, NIWA, https://niwa.co.nz/natural-hazards/extreme-weather-heavy-rainfall
[2]University of Illinois at Urbana-Champaign, News Bureau. "Excessive rainfall as damaging to corn yield as extreme heat, drought." ScienceDaily. ScienceDaily, 30 April 2019. www.sciencedaily.com/releases/2019/04/190430121744.htm.
[3]Andrew Culclasure, Using Neural Networks to Provide Local Weather Forecasts, Georgia Southern University, Spring 2013, 29https://digitalcommons.georgiasouthern.edu/cgi/viewcontent.cgi?article=1031&context=etd.
<?php
require_once $_SERVER['DOCUMENT_ROOT']."google-api-php-client-2.4.1/vendor/autoload.php"; // Google Client API v2.0
require_once "account_verification_token.php"; // Get the verification code.
// Get the variables from the weather station:
// Wind Direction (wd), Average Wind Speed (a_ws), Max Wind Speed (m_ws), 1hr Rainfall (1_rf), 24hr Rainfall (24_rf), Temperature (tem), Humidity (hum), Barometric Pressure (b_pr).
$variables_from_module;
if(isset($_GET['wd']) && isset($_GET['a_ws']) && isset($_GET['m_ws']) && isset($_GET['1_rf']) && isset($_GET['24_rf']) && isset($_GET['tem']) && isset($_GET['hum']) && isset($_GET['b_pr'])){
	$variables_from_module = [
	  "wd" => (int)$_GET['wd'],
	  "a_ws" => (float)$_GET['a_ws'],
	  "m_ws" => (float)$_GET['m_ws'],
	  "1_rf" => (float)$_GET['1_rf'],
	  "24_rf" => (float)$_GET['24_rf'],
	  "tem" => (float)$_GET['tem'],
	  "hum" => (int)$_GET['hum'],
	  "b_pr" => (float)$_GET['b_pr']
    ];
}else{
    $variables_from_module = [
	  "wd" => "err",
	  "a_ws" => "err",
	  "m_ws" => "err",
	  "1_rf" => "err",
	  "24_rf" => "err",
	  "tem" => "err",
	  "hum" => "err",
	  "b_pr" => "err"
    ];
}
/**
* Returns an authorized API client.
* @return Google_Client the authorized client object
*/
function getClient()
{
    $client = new Google_Client();
    $client->setApplicationName('Remote Weather Station'); // Enter your application name.
    $client->setScopes('https://www.googleapis.com/auth/spreadsheets');
    $client->setAuthConfig('credentials.json');
    $client->setAccessType('offline');
    $client->setPrompt('select_account consent');
// Load previously authorized token from a file, if it exists.
// The file token.json stores the user's access and refresh tokens, and is
// created automatically when the authorization flow completes for the first
// time.
    $tokenPath = 'token.json';
    if (file_exists($tokenPath)) {
        $accessToken = json_decode(file_get_contents($tokenPath), true);
        $client->setAccessToken($accessToken);
		print("Token Found!");
    }
// If there is no previous token or it's expired.
if ($client->isAccessTokenExpired()) {
// Refresh the token if possible, else fetch a new one.
if ($client->getRefreshToken()) {
$client->fetchAccessTokenWithRefreshToken($client->getRefreshToken());
} else {
// Request authorization from the user.
$authUrl = $client->createAuthUrl();
// Do not forget to refresh the page after getting the verification code and entering it to the account_verification_token.php.
printf("Open the following link in your browser:<br><br>%s<br><br>", $authUrl); // <= Comment
print 'Do not forget to refresh the page after getting the verification code and entering it to the account_verification_token.php.<br><br>Set the verification code in the account_verification_token.php file.'; // <= Comment
// Set the verification code to create the token.json.
$authCode = trim($GLOBALS['account_verification_token']);
// Exchange authorization code for an access token.
$accessToken = $client->fetchAccessTokenWithAuthCode($authCode);
$client->setAccessToken($accessToken);
// Check to see if there was an error and the account_verification_token is entered.
if (array_key_exists('error', $accessToken)) {
throw new Exception(join(', ', $accessToken));
}else{
print("Successful! Refresh the page.");
}
}
// Save the token to a file.
if (!file_exists(dirname($tokenPath))) {
mkdir(dirname($tokenPath), 0700, true);
}
file_put_contents($tokenPath, json_encode($client->getAccessToken()));
}
return $client;
}
// Get the API client and construct the service object.
$client = getClient();
$service = new Google_Service_Sheets($client);
// Enter your spreadsheetId:
$spreadsheetId = '<spreadsheet_ID>';
// Enter the range (the first row) under which new values will be appended (8 rows):
$range = 'A1:H1';
// Append recent findings from the weather station to the spreadsheet.
$values = [
[$variables_from_module["wd"], $variables_from_module["a_ws"], $variables_from_module["m_ws"], $variables_from_module["1_rf"], $variables_from_module["24_rf"], $variables_from_module["tem"], $variables_from_module["hum"], $variables_from_module["b_pr"]]
];
$body = new Google_Service_Sheets_ValueRange([
'values' => $values
]);
$params = [
'valueInputOption' => "RAW"
];
// Append if only requested!
if(isset($_GET['wd']) && isset($_GET['a_ws']) && isset($_GET['m_ws']) && isset($_GET['1_rf']) && isset($_GET['24_rf']) && isset($_GET['tem']) && isset($_GET['hum']) && isset($_GET['b_pr'])){
$result = $service->spreadsheets_values->append($spreadsheetId, $range, $body, $params);
printf("<br><br>%d cells appended.", $result->getUpdates()->getUpdatedCells());
}else{
print ("<br>Missing Data!");
}