Evaluate the amount of the energy generated by a solar panel at a given direction through light intensity levels.
Advertisement:
Read Later
Evaluate the amount of the energy generated by a solar panel at a given direction through light intensity levels.
Components :
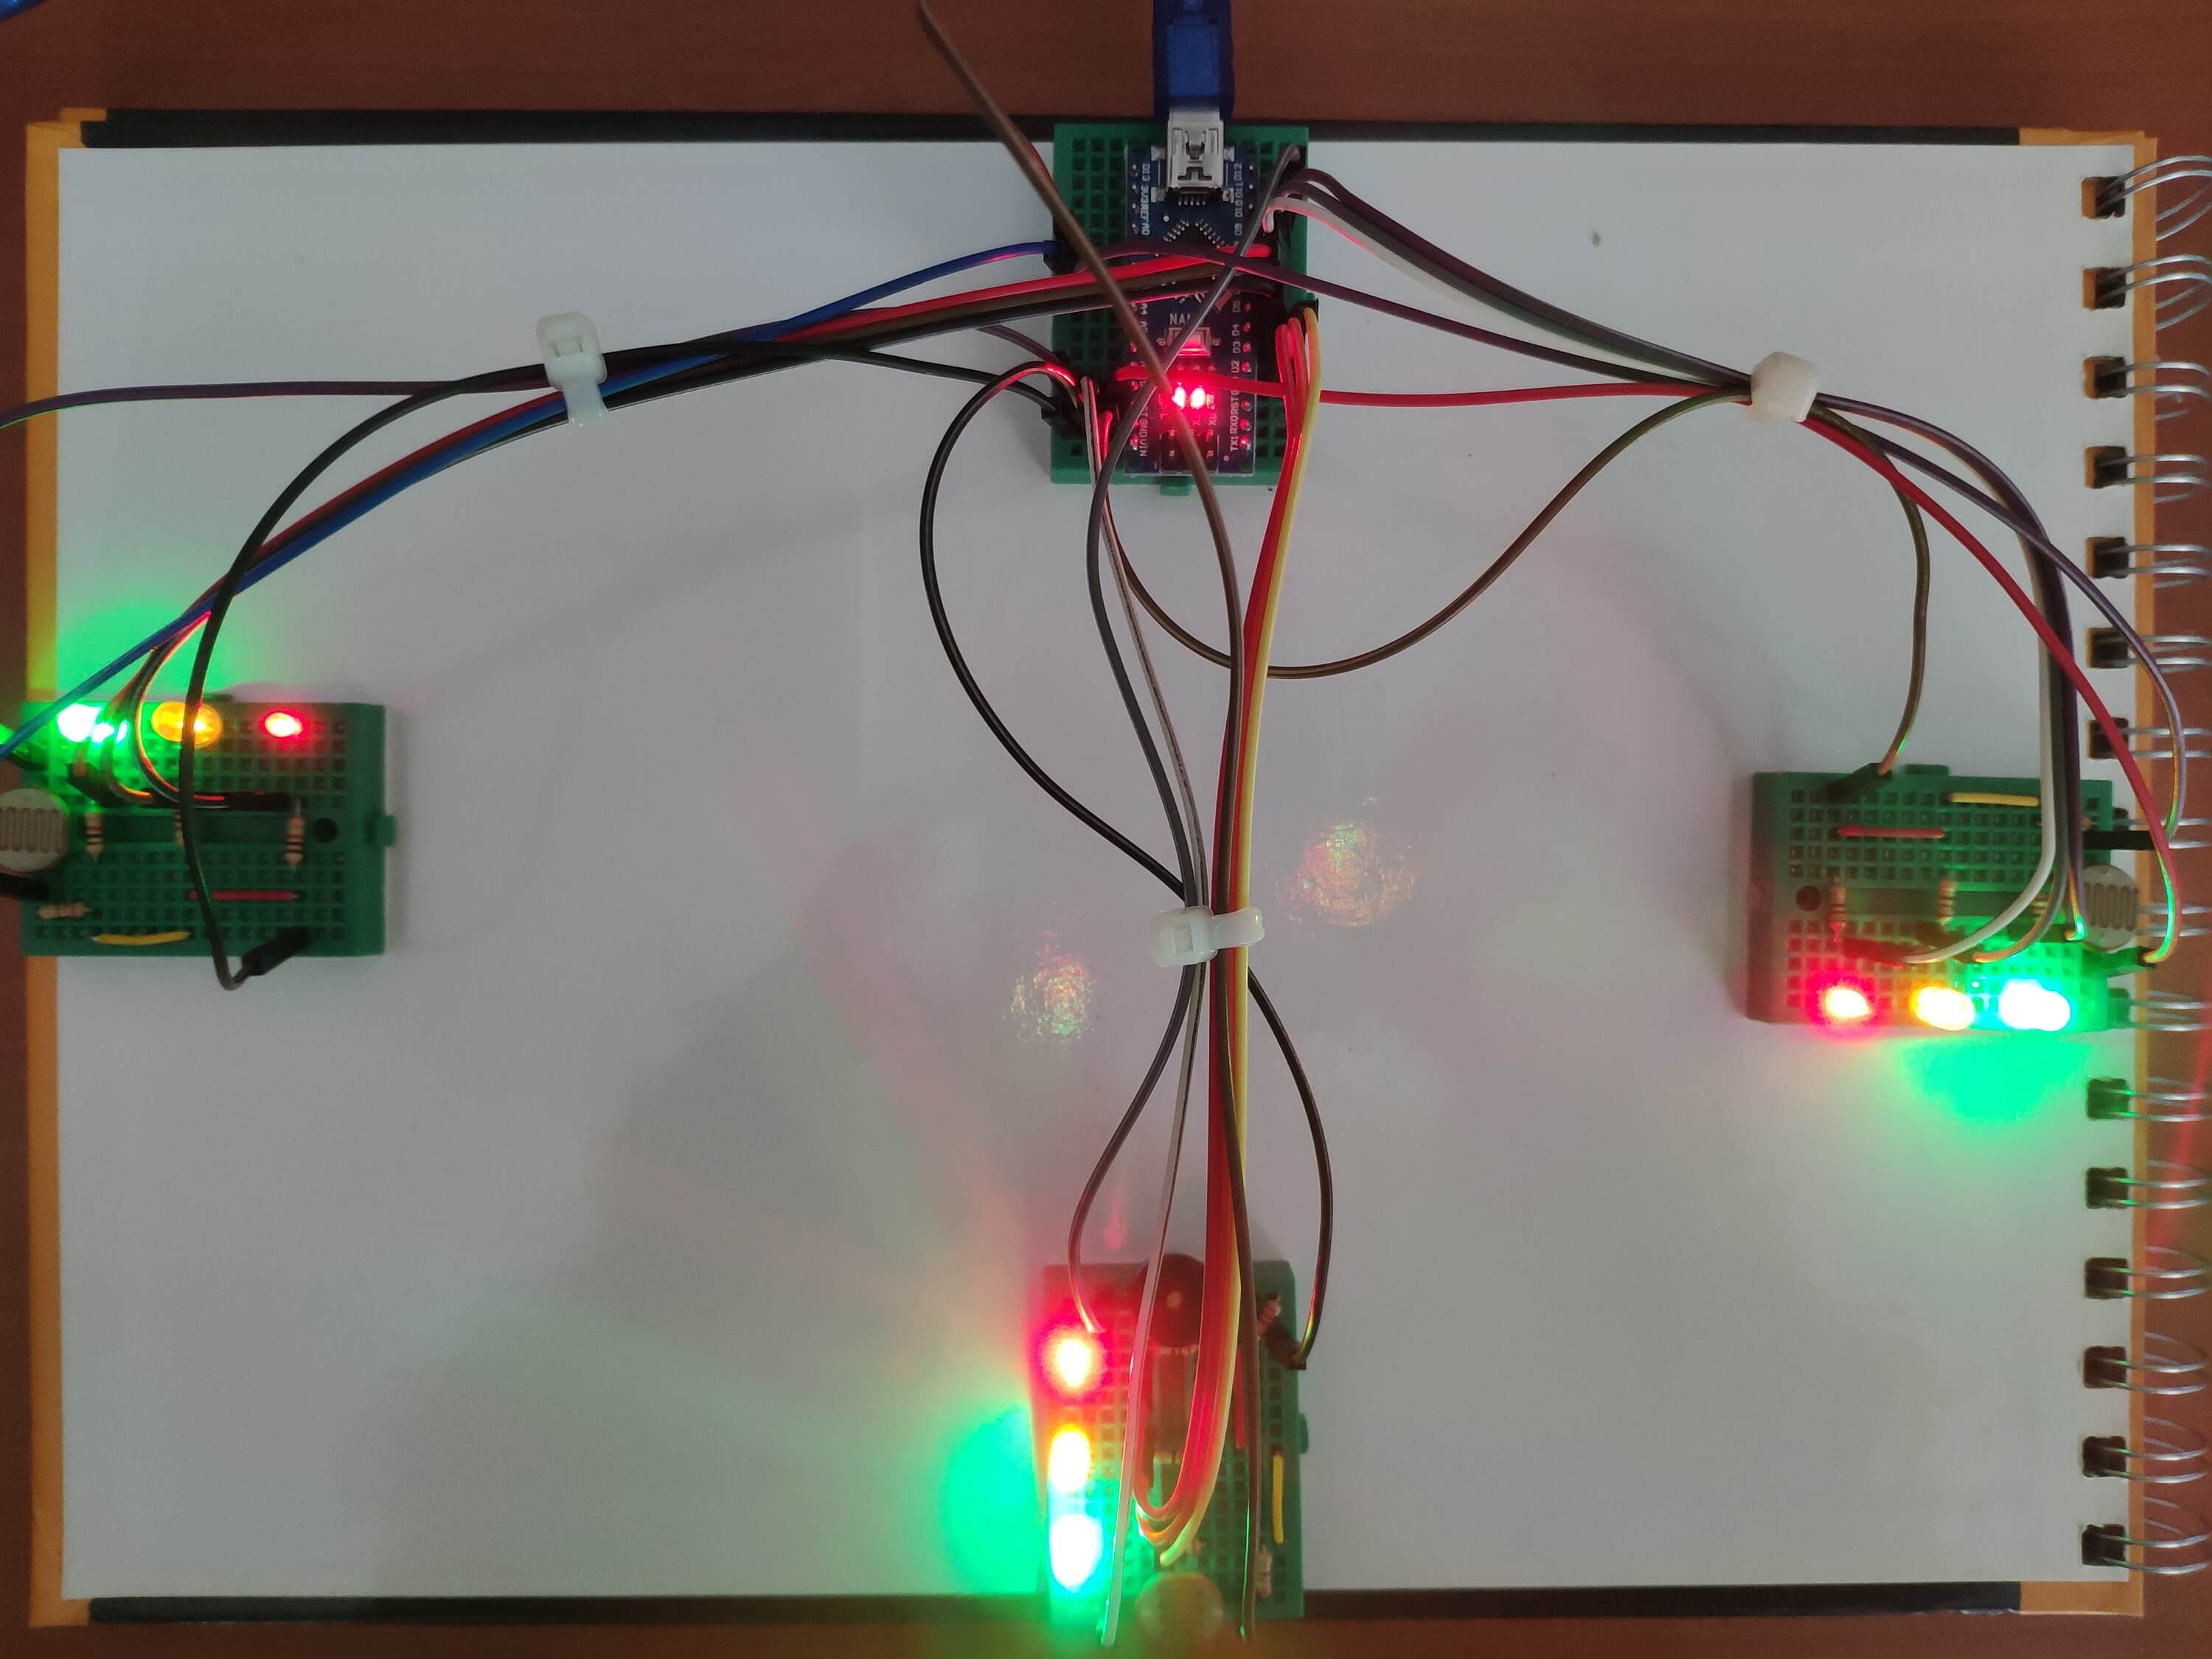
Arduino Nano R3 [1]Mini Breadboard [4]Photo resistor [3]Led [9]Buzzer [1]Resistor(220Ω) [12]Jumper wires [1]I wanted to approximately evaluate the amount of energy generated by a solar panel at a given direction by using light intensity values produced by photo-resistors. Solar panels generate a high amount of energy under high solar radiation relative to the light intensity which is why I intended to use light intensity levels as indicators assigned to led colors – red, yellow and green. In other words, this project is for predicting the amount of energy generated by a solar panel between three light intensity thresholds, and also notifies you when the high threshold exceeded.

[ E = A * r * H * PR ] is the formula for calculating the generated energy by a solar panel, where A is the area of the solar panel, r is the efficiency, H is the average solar radiation and PR is the performance ratio or coefficient( usually 0.75).
You can change all solar panel values at the code below.

You can find a detailed connections guide at the code below.


Connect led, photo-resistor and GND wire to a mini breadboard. And, connect buzzer to control_1 mini breadboard.


Make the connections between all mini breadboards, and it is ready to detect light intensity.


Energy production thresholds has three level at which led colors change:
Low - Red
Moderate - Yellow
High - Green

Also, if you want, get the output through serial ports.

Now, you can use it to charge your Li-Po battery properly via a solar panel.

light intensity.ino
Download
         /////////////////////////////////////////////
        //  Light Intensity and Solar Panel Energy //
       //                Detector                 //
      //             ---------------             //
     //             (Arduino Nano)              //
    //             by Kutluhan Aktar           //
   //                                         //
  /////////////////////////////////////////////

// This project is for predicting the amount of energy generated by a solar panel under the light intensity level given by photoresistors which are placed in three different directions.
// The amount of energy generated by a solar panel is related to the amount of solar radiation which is why I used the light intensity level as an indicator to evaluate it approximately.
// Energy production thresholds has three level at which led colors change:
// Red - Low
// Yellow - Moderate
// Green - High
// You can define threshold values below.
//
// Connections
// Arduino Nano :
//                                controlLed_1_1 [red]
// D2  ---------------------------
//                                controlLed_1_2 [yellow]
// D3  ---------------------------
//                                controlLed_1_3 [green]
// D4  ---------------------------
//                                controlLed_2_1 [red]
// D5  ---------------------------
//                                controlLed_2_2 [yellow]
// D6  ---------------------------
//                                controlLed_2_3 [green]
// D7  ---------------------------
//                                controlLed_3_1 [red]
// D8  ---------------------------
//                                controlLed_3_2 [yellow]
// D9  ---------------------------
//                                controlLed_3_3 [green]
// D10 ---------------------------
//                                Buzzer
// D11 ---------------------------
//                                LDR [1]
// A1  ---------------------------
//                                LDR [2]
// A2  ---------------------------
//                                LDR [3]
// A3  ---------------------------


  // Define control leds as indicators.
  #define controlLed_1_1 2
  #define controlLed_1_2 3
  #define controlLed_1_3 4
  #define controlLed_2_1 5
  #define controlLed_2_2 6
  #define controlLed_2_3 7
  #define controlLed_3_1 8
  #define controlLed_3_2 9
  #define controlLed_3_3 10
  // Define Ldr analog pins to calculate solar panel energy and light intensity.
  #define Ldr_1 A1
  #define Ldr_2 A2
  #define Ldr_3 A3
  // Define the buzzer pin.
  #define buzzerPin 11

  // Define solar panel variables emphasized by the guide. Do not forget to change them.
  #define SP_area 0.0088
  #define SP_efficiency 6.2
  #define SP_coefficient 0.75

  // Define threshold values(low, moderate).
  #define low 8.18
  #define moderate 18.40

  // Define variables to collect light intensity data.
  int LdrData_1;
  int LdrData_2;
  int LdrData_3;


void setup() {
  // Start serial ports.
  Serial.begin(9600);
  Serial.print("System Activated:");
  Serial.print("\n");
  Serial.print("Please connect all photoresistors and led to the defined Arduino Nano pins before uploading the code.");
  Serial.print("\n");
  Serial.print("Do not forget to change solar panel variables and threshold values!");
  // Start led outputs.
  pinMode(controlLed_1_1, OUTPUT);
  pinMode(controlLed_1_2, OUTPUT);
  pinMode(controlLed_1_3, OUTPUT);
  pinMode(controlLed_2_1, OUTPUT);
  pinMode(controlLed_2_2, OUTPUT);
  pinMode(controlLed_2_3, OUTPUT);
  pinMode(controlLed_3_1, OUTPUT);
  pinMode(controlLed_3_2, OUTPUT);
  pinMode(controlLed_3_3, OUTPUT);

}

void loop() {
  gatherLdrData();

  // Initial the indicators at three different directions.

  // Control_1
  IndicatorInitial(SolarPanelEnergy(SP_area, SP_efficiency, LdrData_1, SP_coefficient), controlLed_1_1, controlLed_1_2, controlLed_1_3, 1);
  // Control_2
  IndicatorInitial(SolarPanelEnergy(SP_area, SP_efficiency, LdrData_2, SP_coefficient), controlLed_2_1, controlLed_2_2, controlLed_2_3, 2);
  // Control_3
  IndicatorInitial(SolarPanelEnergy(SP_area, SP_efficiency, LdrData_3, SP_coefficient), controlLed_3_1, controlLed_3_2, controlLed_3_3, 3);


}

void gatherLdrData(){
   // Gather light intensity data from photoresistors each placed in a particular direction.
   LdrData_1 = analogRead(Ldr_1);
   LdrData_2 = analogRead(Ldr_2);
   LdrData_3 = analogRead(Ldr_3);
  }

  float SolarPanelEnergy(float Area, float Efficiency, int Radiation, float PerformansCoefficient){
     // Calculate the energy level of a solar panel approximately by assigning radiation levels to light intensity levels.
     float Energy = Area * Efficiency * Radiation * PerformansCoefficient;
     return Energy;
    }

    void IndicatorInitial(float predictedEnergy, int red, int yellow, int green, int number){
         // Adjust the range of the indicators according to the amount of the energy generated by a solar panel. And, get notified when the high threshold exceeded.
         // Write which control ldr gathers data.
         Serial.print("Control [");
         Serial.print(number);
         Serial.print("] = \t");
         Serial.print(predictedEnergy);
         Serial.print("\n");

         if(predictedEnergy < low){
           digitalWrite(red, HIGH);
           digitalWrite(yellow, LOW);
           digitalWrite(green, LOW);
           noTone(buzzerPin);
          }else if(low <= predictedEnergy && predictedEnergy < moderate){
             digitalWrite(red, HIGH);
             digitalWrite(yellow,HIGH);
             digitalWrite(green, LOW);
             noTone(buzzerPin);
            }else if(predictedEnergy >= moderate){
               digitalWrite(red, HIGH);
               digitalWrite(yellow, HIGH);
               digitalWrite(green, HIGH);
               tone(buzzerPin, 300);
              }

      }

Fritzing File
Download
1 ) Arduino Nano V3
2 ) Photoresistor
3 ) Mini Breadboard
4 ) Buzzer Module for Arduino
5 ) LED Kit for Arduino
6 ) Resistor Kit for Arduino
7 ) U Shape Solderless Breadboard Jumper Cable Dupont Wire Arduino